Ankerui Electric Co., Ltd., Jiading 201801, Shanghai, China;
Abstract: The power monitoring system of Shandong Guojia Functional Materials Co., Ltd. is introduced. Intelligent power meters are used to collect various electrical parameters and switch signals at the distribution site. The system adopts on-site local networking method. After networking, it communicates via the field bus and transmits it to the background. The Acrel-2000 power monitoring system realizes real-time monitoring and power management of power distribution circuit substations.
Keywords: industrial project; Shandong Guoyao Functional Materials Co., Ltd.; substation; intelligent power meter; Acrel-2000; power monitoring system
0 Overview
Shandong Guogu Functional Materials Co., Ltd. is located in the economic and technological development zone of Dongying, a high-efficiency eco-economic zone in the Yellow River Delta and a core area in the Shandong Peninsula Blue Economic Zone. It is a comprehensive research and development, production, marketing and service. Sexual Sino-foreign joint ventures, covering an area of ​​more than 160 acres, the company focused on the development of dielectric materials, is the leading domestic and global advanced technology media companies.
This project is an electric power monitoring system of Shandong Guojia Functional Materials Co., Ltd. According to the requirements of power distribution system management, it is necessary to perform power monitoring on the low-voltage distribution lines in the BT2 and CF1 substations of Shandong Guoyan Functional Materials Co., Ltd. to ensure the safety, reliability, and high efficiency of electricity usage.
Acrel-2000 low-voltage intelligent power distribution system takes full advantage of the latest developments in modern electronic technology, computer technology, network technology and fieldbus technology, and conducts distributed data acquisition and centralized monitoring and management of the power distribution system. The secondary equipment of the distribution system is networked. Through the computer and the communication network, the field devices of the decentralized power distribution station are connected into an organic whole, and the remote monitoring and centralized management of the power grid operation is realized.
1, system structure description
There are a total of two power distribution rooms in this project, among which there are 191 ACR220EFL multifunction meters, 4 ACR220EFLH multifunction meters, 270 ARD2F motor protectors in the BT2 power distribution room, and 63 A CR220EFL multifunction meters in the CF1 power distribution room, 4 Only ACR330EFLH multifunction instrument, 32 ARD2F motor protectors. The duty room is located next to the BT2 power distribution room, and 3 Nport5630-16 serial port servers are placed. An 8-port collection box is placed in the CF1 distribution room. The on-site meter is connected to the corresponding serial port server via the 485 bus, and the on-site serial port server transmits the data to the monitoring host via the network cable or the light.
The monitoring system adopts a hierarchical distributed structure, ie station control layer, communication layer and bay layer.
Interval device layer is mainly: multi-function network power meter, smart motor protector open and so on. These devices are corresponding to the corresponding primary equipment installed in the electrical cabinet, these devices are used RS485 communication interface, through the on-site MODBUS bus network communication, data acquisition on the spot.
The main network communication layer is: industrial serial server. Its main function is to collect the scattered data in the field collection device, and transmit it to the station control layer at the same time, to complete the data exchange between the field layer and the station control layer.
Station control management: equipped with high-performance industrial computers, monitors, UPS power supplies, printers and other equipment. The monitoring system is installed on the computer to collect and display the operating status of the field equipment and display it to the user in the form of human-computer interaction.
The above field devices all adopt RS485 interface and MODBUS-RTU communication protocol. RS485 adopts shielded cable for transmission. Generally, two connections are used to make the connection simple and convenient. The communication interface is half duplex communication. Both parties can receive and send data. Only data can be sent or received at the same time. The maximum data transmission rate is 10Mbps.
The RS485 interface is a combination of balanced drivers and differential receivers. It has enhanced noise immunity and allows up to 32 devices to be connected on the bus. The maximum transmission distance is 1.2 km.
2. Main functions of the power monitoring system
2.1 Data Acquisition and Processing
Data acquisition is the basis of power distribution monitoring. Data collection is mainly accomplished by the underlying multi-function network instrumentation, realizing local real-time display of remote data. The signals that need to be collected include: three-phase voltage U, three-phase current I, frequency Hz, power P, power factor COSφ, power Epi, and remote device operating status.
The data processing mainly displays the electrical parameters collected according to requirements in real time and accurately to the user, so as to meet the requirements of automation and intelligence of the power distribution monitoring, and store the collected data in the database for user query.
2.2 Human-computer interaction
The system provides simple, easy to use, and good user interface. Using the Chinese interface, the CAD graphic shows the electrical main wiring diagram of the low voltage distribution system, shows the status of the distribution system equipment and the corresponding real-time operating parameters, the screen timing switching tour; dynamic refresh of the screen real-time; analog display; switch display; continuous Record display and so on.
2.3 Diachronic events
The duration event viewing interface provides users with easy and friendly human-computer interaction by viewing the fault records, signal records, operation records, and over-limit recordings that have occurred. You can view the platform through historical events. You can easily locate the fault according to your requirements and query conditions. The historical events that you want to view provide you with good software support for the overall system operation.
2.4 Database Establishment and Query
It mainly completes the remote measurement and remote signal acquisition, and establishes a database to generate reports regularly for users to query and print.
2.5 User Rights Management
For different levels of users, different permission groups are set to prevent the losses caused by human misoperation to production and life, and to realize the safe and reliable operation of the distribution system. You can use user management to perform user login, user logout, password change, and add/delete operations to facilitate user modification of accounts and permissions.
2.6 Running load curve
The load trend curve function is mainly responsible for regularly collecting incoming lines and important loop current and power load parameters, and automatically generating running load trend curves to facilitate users to know the operating load status of the equipment in a timely manner. Click the corresponding button or menu item of the screen to complete the switching of the corresponding function; you can view the real-time trend curve or historical trend line; you can perform translation, zoom, range conversion and other operations on the selected curve to help the user to enter the trend analysis and fault recall. Analyzing the entire system's operating status provides intuitive and convenient software support.
2.7 Remote Report Query
The main function of the report management program is to design the report style according to the needs of the user, and the data processed in the system is filtered, combined and statistically generated to generate the report data required by the user. This program can also be based on the needs of users of the report file to save, print or summon save, print mode. At the same time, this program also provides users with management functions for generated report files.
The report has the functions of freely setting the query time to realize daily, monthly, and annual energy statistics, data export, and report printing.
3, case analysis
The incoming circuit uses ACR220EFLH/ACR330EFLH multifunctional power meters, which are network power meters designed for the power monitoring needs of power systems, industrial and mining enterprises, public facilities, and smart buildings. It can measure all conventional power parameters, such as three-phase voltages. , current, active power, reactive power, power factor, frequency, active power, reactive power, and can monitor voltage, current 2-31 harmonic components and other electrical parameters. And this instrument has 4 photoelectric isolation digital input contacts and 2 relay control output contacts. These contacts can be used with intelligent circuit breakers to achieve remote signaling and remote operation of the circuit breaker. The series of network power meters are mainly used in substation automation, distribution network automation, residential power monitoring, industrial automation, energy management systems and intelligent buildings.
The important distribution circuit adopts ACR220EFL series multifunctional power meters. The meter mainly measures all conventional power parameters such as: three-phase voltage, current, active power, reactive power, power factor, frequency, active power, and reactive power.
The secondary map of low-voltage power distribution is shown in Fig. (1). The function power meter telemetry mainly monitors the electrical parameters of the operation equipment, including: line three-phase voltage, current, power, power factor, electrical energy, frequency and other electrical parameters and distribution loops. Three-phase current; remote signal function to display the operating status of field devices, mainly including: switching of the switch, closing operation status and communication failure alarm; when the circuit breaker is dislocated, it will send an alarm signal to remind the user to deal with the fault in time.
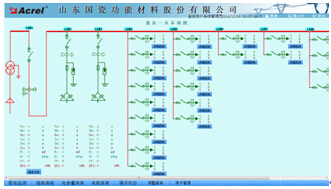
Figure (1) Secondary diagram of low voltage distribution
The remote signaling and telemetry alarm functions mainly complete the monitoring of the switching operation status and load incoming line of the low-voltage outlet loops, and indicate the specific alarm position and audible alarm to the switch displacement and load over-limit pop-up alarm interface to remind the on-duty personnel to deal with it in time. The load limit can be set freely under the corresponding authority. With history query function. See Figure (2).
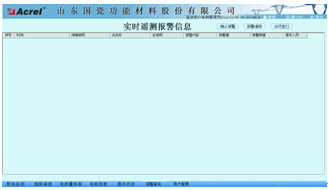
Figure (2) Historical Telemetry Alarm Information Query
The parameter reading function mainly inquires into the electrical parameters of the low-voltage outlet circuit. Supports electrical parameter query at any time, with functions such as data export and report printing. The report queries the electrical parameters of the low-voltage loops for the four transformer substations of the two substations, mainly including: three-phase current, active power, active power, and transformer temperature. The names of the loops in this report are associated with the database to facilitate the user to modify the loop name. See Figure (3).
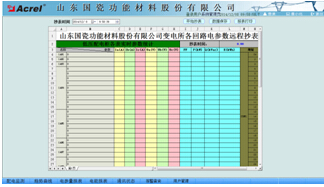
Figure (3) Parameter reading
The electricity consumption report function can select the time period to inquire, supports the accumulated electricity inquiry at any time, and has the functions of data export and report printing. Provide accurate and reliable power report for duty personnel. The names of the loops in this report are associated with the database to facilitate the user to modify the loop name. As shown in the figure below, the precise power consumption of each distribution circuit in a certain period of time in the fitness center can be displayed. The user can print the report directly, and can save it in EXCEL format to another location. See Figure (4).

Figure (4) Energy Report
The schematic diagram of the system communication structure mainly shows the networking structure of the system. The system adopts a hierarchical distributed structure and simultaneously monitors the communication status of the equipment at the bay level. Red indicates normal communication and green indicates communication failure. See Figure (5).
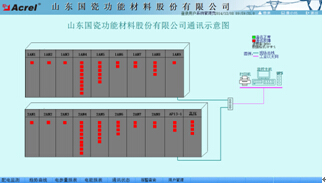
Figure (5) System Communication Structure
The load trend curve interface allows you to visually check the load operation of the loop. View real-time and historical trend curves, click the corresponding button or menu item to complete the switching of corresponding functions; help the user to enter the trend analysis and fault recall, with curve printing function. Provides intuitive and convenient software support for analyzing the health of the entire system. See Figure (6).

Graph (6) Trend Graph
4 Conclusion
With the development of society and the wide application of electricity, the power monitoring system has become an inevitable choice for large-scale multi-substation users, such as key construction projects, landmark buildings, and large-scale public facilities throughout the country. The Acrel-2000 power monitoring system introduced in this paper is introduced. The application of Shandong Guogu Functional Materials Co., Ltd. can realize the real-time monitoring and power management of substation low-voltage power distribution circuits. It not only can display the power status of the circuit, but also has the function of network communication, and can be used with serial server and computer. And so on constitute a power monitoring system. The system analyzes and processes the collected data, displays the running status of each distribution circuit in the substation in real time, has a pop-up alarm dialog box and voice prompts for the closing and closing of the load, and generates various energy reports and analysis curves. Graphics, etc., to facilitate remote meter reading and analysis, research. The system is safe, reliable and stable. It provides real and reliable basis for users of substations to solve electricity problems and has achieved good social benefits. [2]
references:
[1]. Ren Cheng, Zhou Zhongzhong. Principles and Application Guide for Digital Meters for Electric Power Measurement [M]. Beijing. China Electric Power Press, 2007. 4
[2].Zhou Zhouzhong, et al. Product Selection and Solution for Smart Grid User-end Power Monitoring and Power Management System[M]. Beijing. Machinery Industry Press. 2011.10
About the author: 牟芸 Female, Ankerui Electric Co., Ltd., the main research direction for the motor protection energy-saving control, mobile phones, landline, QQ